
‘Location’ is the ingrained mantra used as a simple explainer of the primary driver for property prices. However, what if the desire for location loses relevance? What if ‘desirable locations’ are redefined based on a shift in perception? It can be said that this is always the case of course, the nature of the property stock is one of constant change matched with the corresponding change in preferences of the population that occupies it.
A drastic and collective singular change of preference reflected in actual transactions is unusual nonetheless; as is a drastic and collective realisation of how small life is – namely, the shift in perception associated with seeing all aspects of life through the lens of lockdown. Each home becomes relatively smaller as workspaces are established and access to other internal spaces (workplace, cafes, shops, gym) via more space (outdoors, bus, train, tube) either vanishes or is diminished. It’s a matter of relativity; size always mattered, but now, size matters!
The lockdown effect is shown using the Harness PPSM (price per square metre) dataset, an output of the Data Fabric platform which utilises proprietary connection technology to join the following Open Government datasets:
- HM Land Registry Price Paid (price and transaction date)
- MHCLG Non-Domestic EPC (floor area)
- MHCLG Domestic EPC (floor area)
- VOA Rating List (floor area)
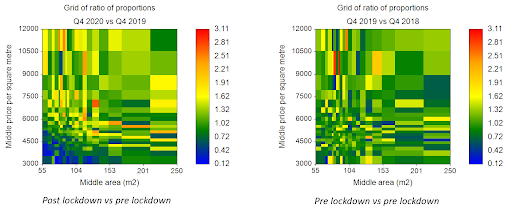
The PPSM data from Q4 2018 onwards is segmented across the range of floor area and PPSM values into 5 percentile buckets to produce a 20 by 20 grid (note, the top and bottom 1% are excluded to reduce outlier distortion). These 400 cells are used to capture the proportion of transactions that occur in each period (either Q1 or Q4) by dividing the count in the cell by the total count across all cells. The ratio of proportions for the same quarter one year apart are compared – post-lockdown versus pre-lockdown and pre-lockdown versus pre-lockdown – to give the relative change in sale activity. The pre-lockdown comparisons are conceptually taken to be ‘normal’. The results are plotted as a contour grid with the axes set by taking the middle value of the data dimensions in each bucket. These are shown side by side below for 2nd hand house sales (terrace, semi and detached) inside and outside London.
Houses, resale, inside London, 2018-2020 Q4 comparisons
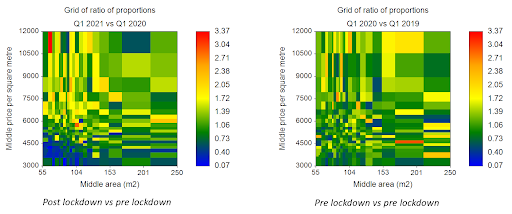
Houses, resale, inside London, 2019-2021 Q1 comparisons
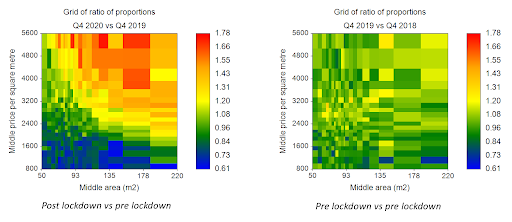
Houses, resale, outside London, 2018-2020 Q4 comparisons
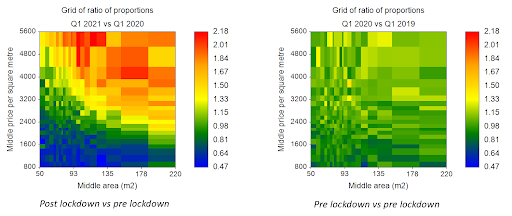
Houses, resale, outside London, 2019-2021 Q1 comparisons
Key observations
- Inside London, post-lockdown versus pre-lockdown there is a relative decrease in transactions of smaller houses with low PPSM – as low as one tenth of sales activity compared to the same quarter pre-lockdown, concentrated at floor areas less than about 100m2 and PPSM less than about 4,500 £/m2. Conversely, a less obvious parabola shaped zone is observed beyond these limits showing a relative increase in transactions (ratios around 1.7). The proportion of transactions are largely similar year-on-year at floor areas greater than about 150m2 and PPSM greater than about 6,000 £/m2.
- Inside London, pre-lockdown versus pre-lockdown there is no distinct grouping of relative change either way across the size and PPSM range.
- Outside London, post-lockdown versus pre-lockdown the delineation of change is much clearer than inside London and applies across all sizes and PPSM values. Parabola shaped zones of similar sales activity are seen to change from a relative decrease in transactions of small houses with low PPSM to relative increase in transactions of larger houses with higher PPSM. The range of ratios is tighter than inside London, which is attributed to less market non-homogeneity along with more data, hence robustness, for analysis. For example, for Q4 2020 there are circa 175,000 records outside London versus circa 13,000 records inside London[1].
- Outside London, pre-lockdown versus pre-lockdown shows minor relative change across all price and size bands. In other words, sales activity neither increased nor decreased across the size and PPSM dimensions. This is the conceptual ‘normal’ referred to previously.
So What?
It is for others to comment on the potential ramifications of the current situation and impacts on the housing market, though it seems obvious that scarcity of desirable property is intensified if buying behaviour is redefined by the increased importance of space and the intersection with preference for location.
Rather, this analysis is only possible through data enablement – that is, the data is simply not available via any single raw feed – and the Harness approach to data stitching ensures the whole picture is seen; without opinion and all-inclusive. For a given set of raw data, Data Fabric provides the largest unified view. Yes, size really does matter!
[1] Lag in release of HM Land Registry data and availability of floor area data from other sources may also skew the calculated proportions.